Reduce your carbon footprint with Sulapac
Today, most companies have sustainability strategies, and ambitious goals to reduce their carbon footprint. Instead of just compensating emissions, by using renewable materials, like Sulapac, you can keep your carbon cycle in balance naturally.

The ABC of LCA – understand your impact
Life cycle assessment (LCA), and especially carbon footprint, is perhaps one of the most recognized metrics that is used to evaluate the environmental effect of a product. It is also a topic most frequently raised by clients when they want to improve their sustainability performance. LCA is a tool that helps to evaluate and understand some of your major impacts on the environment.

Sulapac has a reduced carbon footprint compared to conventional plastics
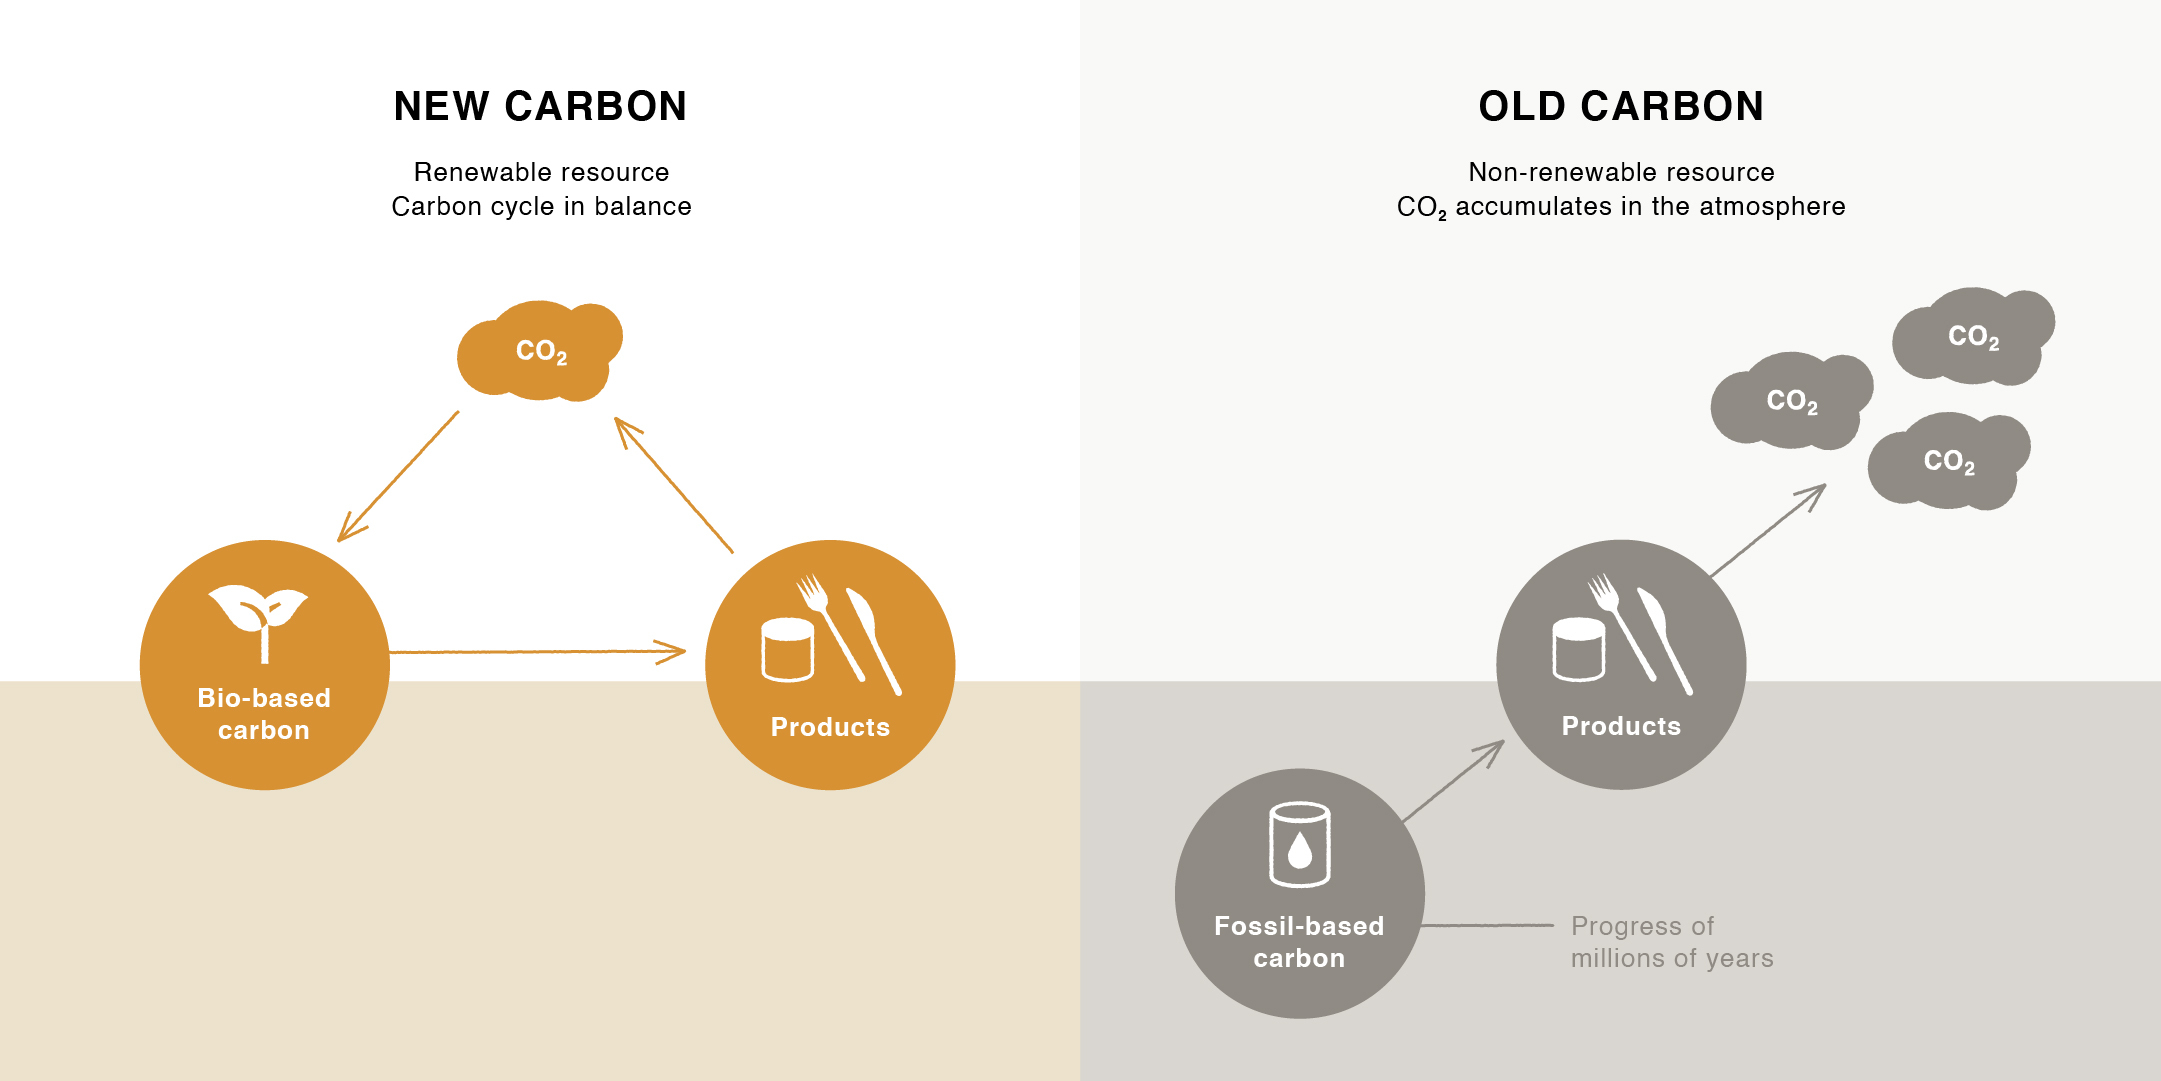
The main components of our sustainable Sulapac® materials are plant-based binders and responsibly sourced wood from industrial side streams. As these trees and plants grow, they absorb CO2 from the atmosphere via photosynthesis. When Sulapac biodegrades into CO2, water and biomass like wood in nature, its carbon cycle stays in balance with nature. On the contrary, fossil-based raw materials have been created over millions of years underground. When old carbon, like oil, are dug up and consumed, it causes an imbalance between the rates of carbon fixation and carbon release, which then leads into accumulation of CO2 in the atmosphere. Thus, in order to combat the climate change, we strive to replace fossil-based materials with bio-based ones as much as possible.
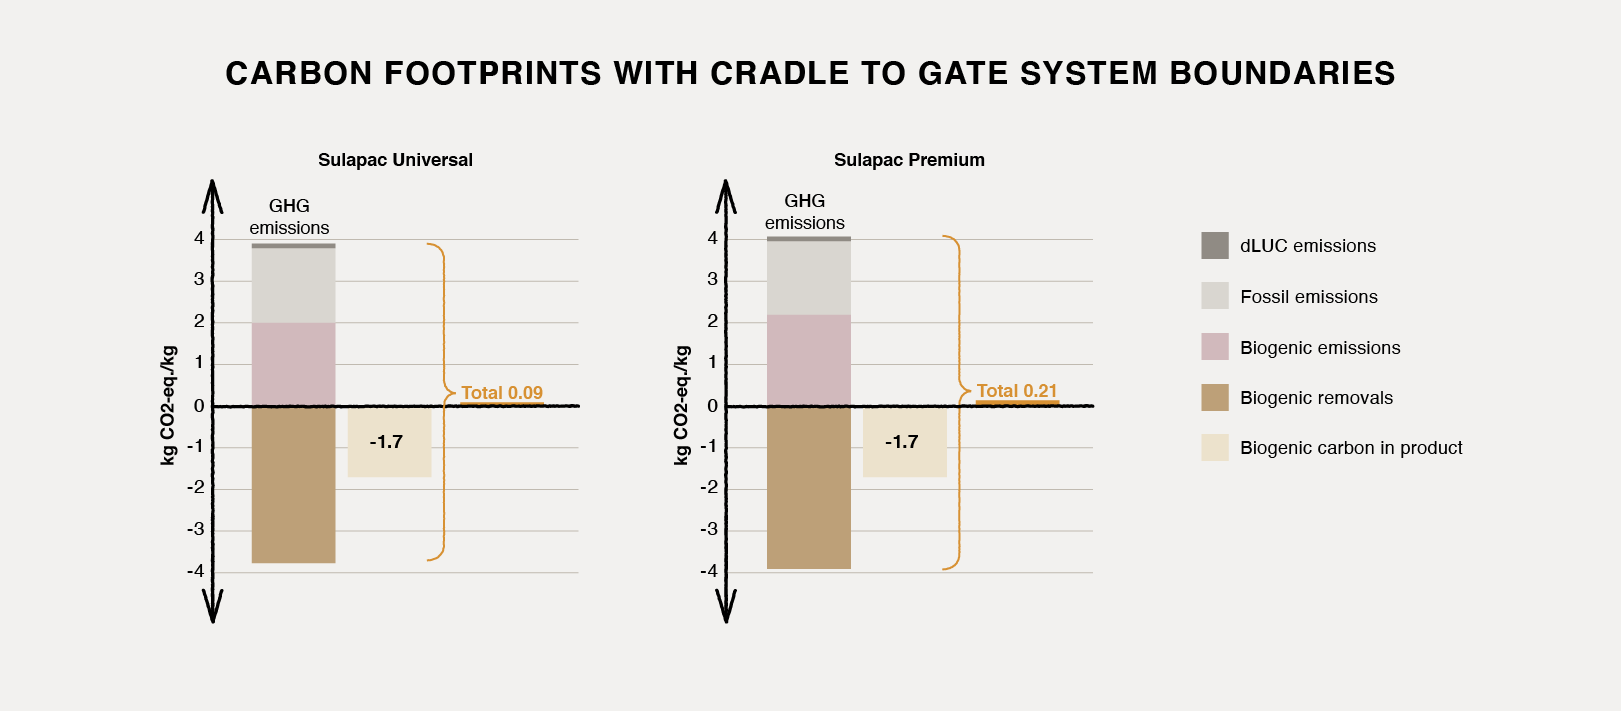
Sulapac was founded by Doctors of Biochemistry and all our claims are science based. True to our principles, we have calculated the carbon footprint of Sulapac Universal and Sulapac Premium materials. The analysis were made as cradle to gate, evaluating the kgCO2eq. per 1 kg of raw material. Our study was performed by an independent consulting company LCA Consulting and it was internally critically reviewed.
Here are the numbers
Let’s deep dive into this study. The results show that the carbon footprint is 0,09 kgCO2eq./kg for Sulapac Universal and 0,21 kgCO2eq./kg for Sulapac Premium. Carbon footprint is calculated including biogenic carbon. These can be seen in the figure 1.

It is important to understand that methods and metrics with these indicators are still developing and they are not necessarily always comparable. However, our customers often want to know Sulapac’s carbon footprint compared to conventional fossil-based plastics. Hence, we have collected values that are available from public databases enabling an indicative comparison. Correspondingly, based on various recourses, the difference in emissions is significant. For example, according to the data by Plastics Europe HDPE has a carbon footprint of 1,80 kgCO2eq./kg and PP: 1,63 kgCO2eq./kg while the data by GPCA shows that HDPE has a carbon footprint of 1,70 kgCO2eq./kg and PP: 1,95 kgCO2eq./kg. These can be seen in the figure 2.

Sulapac materials can be recycled
Cradle-to-Grave (or Cradle-to-Cradle) pays attention to whole lifecycle. When discussing end-of-life, carbon emissions is an important, but not the only sustainability indicator. Other environmental problems like littering, microplastics and marine protection should also be considered.
The climate impact of a product depends on whether the material is recycled or disposed; what the resource efficiency of the recycling is; and will carbon be released into the atmosphere or not.
Sulapac material can be recycled with high material efficiency organically (industrial composting) as well as mechanically and chemically – but to continue the comparison with conventional plastic we can look at the scenario of incineration.
Emissions of a product that is incinerated
If Sulapac material is incinerated, the carbon in the material would be released resulting in 1,8 kgCO2eq./kg for Sulapac Universal and 2,0 kgCO2eq./kg for Sulapac Premium with cradle-to-grave system boundaries.
Considering conventional plastics, both HDPE and PP consist of approximately 86 % of carbon (fossil). Burning these materials would result in 3,1 kgCO2e/kg for HDPE (C2H4) and 3,1 kg CO2e/kg for PP (C3H6) taking the total impact up to 4,8-4,9 kgCO2eq./kg for HDPE and 4,7-5,0 kgCO2eq./kg for PP when cradle-to-grave life cycle is considered.
It is also important to note that there is a fundamental difference between carbon released from burning biobased materials and fossil fuels: burning fossil fuels releases carbon that has been locked up in the ground for millions of years, while burning biomass emits carbon that is originated from the biogenic carbon cycle. In other words, biomass combustion simply returns to the atmosphere the carbon that was absorbed as the plants grew.
In incineration with energy recovery, Sulapac material does not cause hazardous emissions or remnants in ashes, which are possible to recycle as nutrients or filler materials. Carbon capture and power-to-x solutions producing renewable fuels are future possibilities, which also serves carbon-neutral recovery of novel bio-based materials.
Choose carbon-neutral future today
Field of plastics is rapidly changing with increasing pressure from consumers and investors alike. As shown above, Sulapac is a very competitive option also from climate perspective. Along with sustainable forestry and effective use of side streams and recycled content, utilizing of biomass will remain vital for us to achieve a carbon-neutral future.
“Even though the study focused solely on the carbon footprints of Sulapac Universal and Premium materials, the results imply that the carbon footprints of Sulapac materials are lower compared to plastics made of virgin, oil-based raw materials. Carbon footprint results provide valuable information for the users of Sulapac materials who are willing to decrease their own carbon footprint.” – Miia Liikanen, LCA Consulting Oy