How Lean6sigma methods make a difference: ensuring consistent quality in Sulapac materials
Lean6sigma is a proven methodology that originated from the combination of two well-established process improvement approaches: Lean, developed from Toyota’s manufacturing principles to eliminate waste, and 6Sigma, introduced by Motorola to reduce variation and defects through statistical control. It is widely used across industries such as automotive, electronics, pharmaceuticals, and increasingly in sustainable materials manufacturing, helping organizations continuously improve quality, efficiency, and customer satisfaction.
Lean6sigma methods are used at Sulapac to analyze, develop and standardize production. For customers relying on Sulapac materials in their own production, this means fewer production disruptions, predictable performance, and high end-product quality. Through Lean6sigma methods, we ensure our manufacturing processes are stable and capable of producing consistent quality reliably, batch after batch.

How Lean6sigma methods are applied to Sulapac production
Our key measurement which reflects the processability and quality of our materials is MFI, melt flow index. MFI (Melt Flow Index), also known as MFR (Melt Flow Rate), is a measure of how easily a thermoplastic polymer melts and flows under specific conditions.
To create and maintain production consistency, we apply statistical methods to analyze the MFI results of our production. MFI specifications are determined based on customer needs as well as our actual manufacturing process behaviour, to reflect true mass production capabilities while minimizing scrap. For new materials, initial MFI specifications are set using a ±3 sigma approach. This approach ensures an extremely small margin of error already in the beginning of new material production. Later, when the material is in production, statistical methods are used to verify and maintain process stability. This continuous process capability monitoring, combined with our knowledge of our customers’ production processes and their requirements, enable us to develop and consistently produce materials, which work perfectly in our customers’ production machines.
Our verification criteria consist of:
- Process Capability Index (Cpk) above the industrial standard of 1.33
- Process Performance Index (Ppk) meeting or exceeding 1.33
- Continuous improvement towards minimising amount of scrap and maximising consistent quality
This approach ensures that Sulapac materials not only meet but exceed customer expectations – consistently and efficiently.
Example: long-term production data confirming process stability and full yield
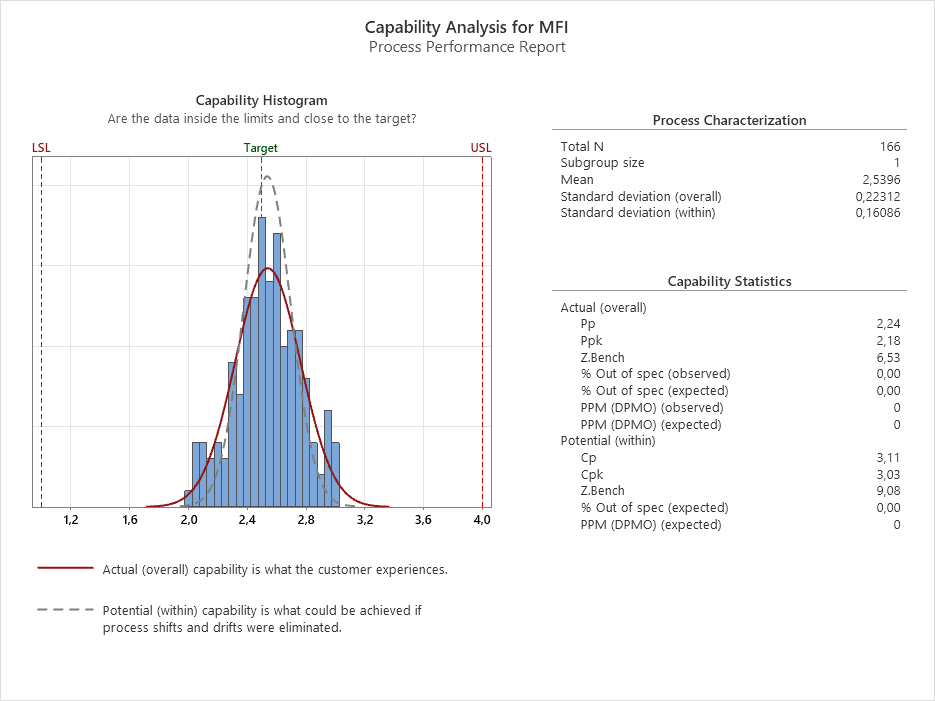
For Sulapac Flow 1.7, we used full data covering the entire production history, in the manufacturing process stability evaluation. We had originally set the internal production control limits tighter (MFI 2 – 3) than the official material specification limits (MFI 1 – 4) to ensure early detection of variation. We analyzed the production dataset through process capability analysis.
Results confirmed exceptional process control
The analysis showed that the production process is in excellent control. Throughout the entire production volume, the material consistently met the quality specifications, with both Cpk and Ppk values well above the target thresholds.
We observed that the long-term process mean deviates slightly, and statistically significantly, from the nominal centre of the material specification. However, this minor shift has no practical impact on performance or quality. On the contrary, due to the high process capability and stability, the calculated yield for Sulapac Flow 1.7 is effectively 100%.
Delivering reliable performance to customers
From the customer perspective, this means exceptional consistency in Flow 1.7 material, batch after batch. The fact that our manufacturing process operates so well within the control limits ensures that our customers receive consistent and high-quality Sulapac material, with no variation which would affect their production or final product quality. This ensures stable processing behaviour in customer’s own production and reliable end-product performance.
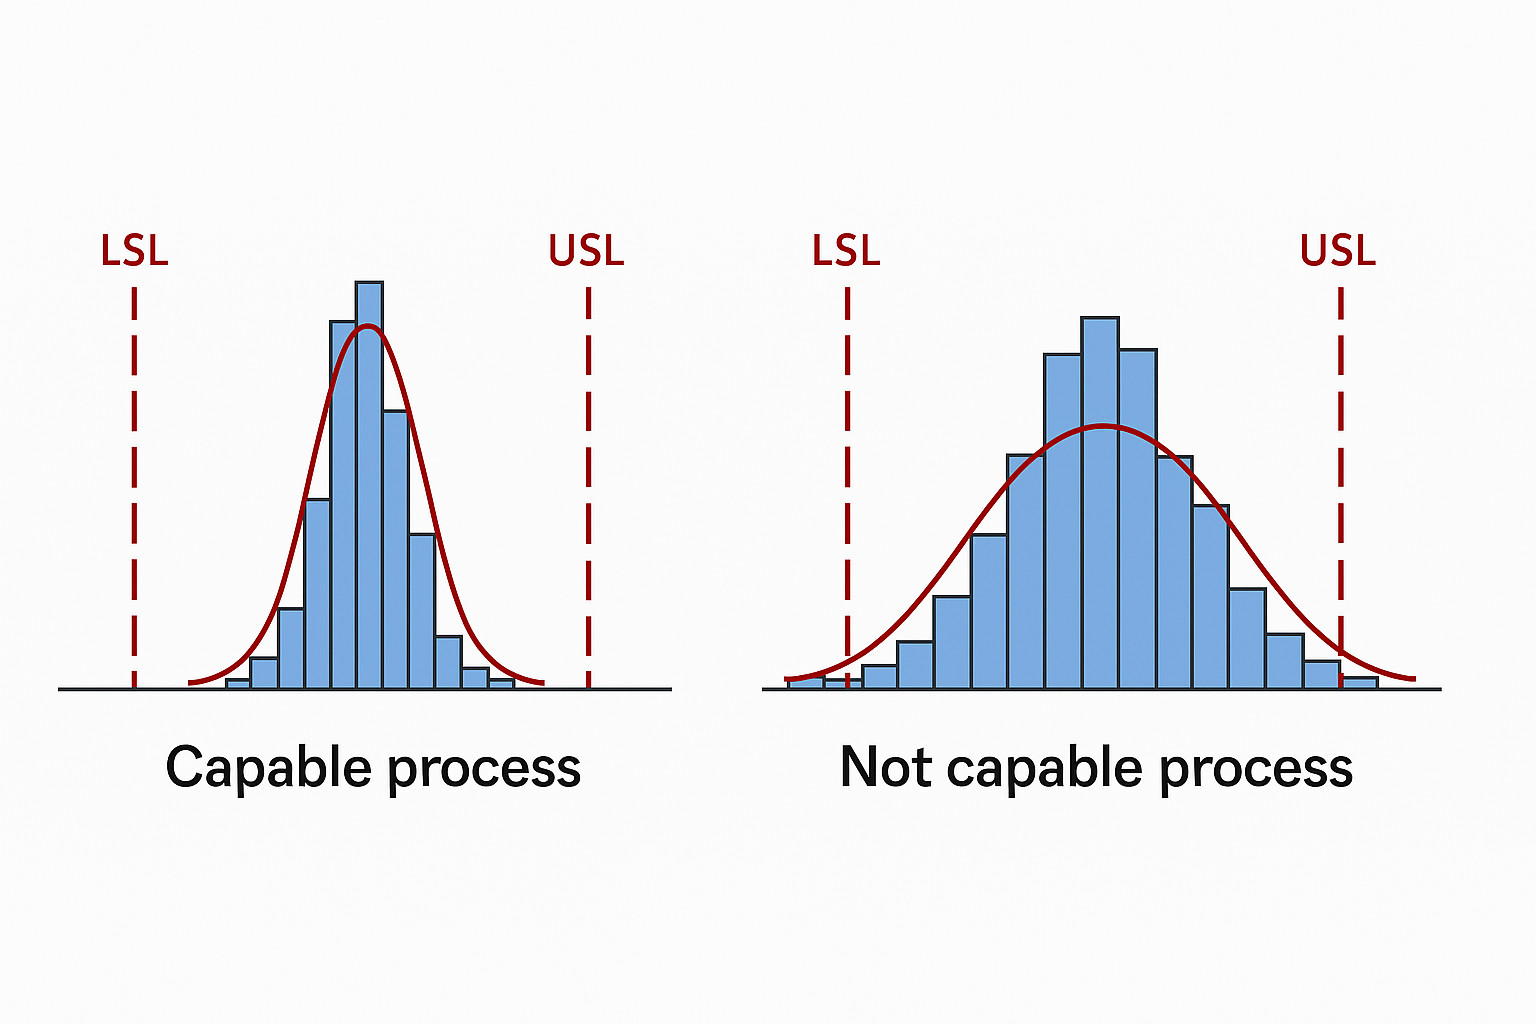
How to read process spread in capability analysis:
LSL = lower specification limit, USL = upper specification limit. When the data (blue bars / bell curve) are all in between the LSL and USL, the production is considered capable. The tighter the bars are together / the narrower the bell curve is, the higher the process capability is. If the data (blue bars / bell curve) cross the LSL and/or USL, it means that the process is not capable of staying within the specified limits.
Example: capability analysis driving specification development
Statistical analysis of Sulapac Universal Flex 35 revealed a high risk of production failing the MFI specifications, despite highly consistent process performance. This indicated that the manufacturing process was stable and repeatable, but the MFI specification did not accurately reflect the actual mass production output, leading to risk of unnecessary scrap.
First we analyzed the production data using I-MR chart, which is a type of control chart used in statistical process control to monitor the stability and variability of a process over time. As a result, we found that the MFI specification should be redefined by applying the ±3 sigma approach. Although the originally produced material consistently performed well for customers, the misalignment between process behaviour and MFI specification caused an unnecessarily high scrap rate in Sulapac production.
Refining specifications to match real production
Once we had found the new MFI specification which our production is capable of producing, we compared the new values with our knowledge of our customers’ injection molding processes and how the new limits would fit to their flow rate requirements. We found that the adjustment of MFI specification was not likely to impact our customers’ processes.
And last we analyzed the data by means of process capability analysis. By updating the MFI specification to reflect real-world process capability, we were able to minimize the predicted scrap and bring it in line with actual mass production performance — without compromising quality or customer satisfaction.
Data-driven insight strengthens quality and efficiency
This case highlights the value of applying Lean6sigma methods and statistical analysis in understanding true production performance. The analysis clearly demonstrated that the production process itself was well controlled and did not require improvement. Instead, the issue was rooted in specification which did not represent the actual capabilities of the process.
Detecting this through data-driven methods was highly important for us. It enabled us to avoid unnecessary development actions, we got the confidence to let the process continue to operate as efficiently as it was before, and we were able to align MFI specifications with real production behaviour. This not only improved our internal efficiency, but also strengthened our quality assurance and confidence on customer satisfaction.
Mikko Huttunen
Manufacturing Development Lead
Aino Tynkkynen
Quality Director